Plate Modal Analysis - Course Paper
A memo describing the experimental setup and results of modal response characterization of a polycarbonate sheet.
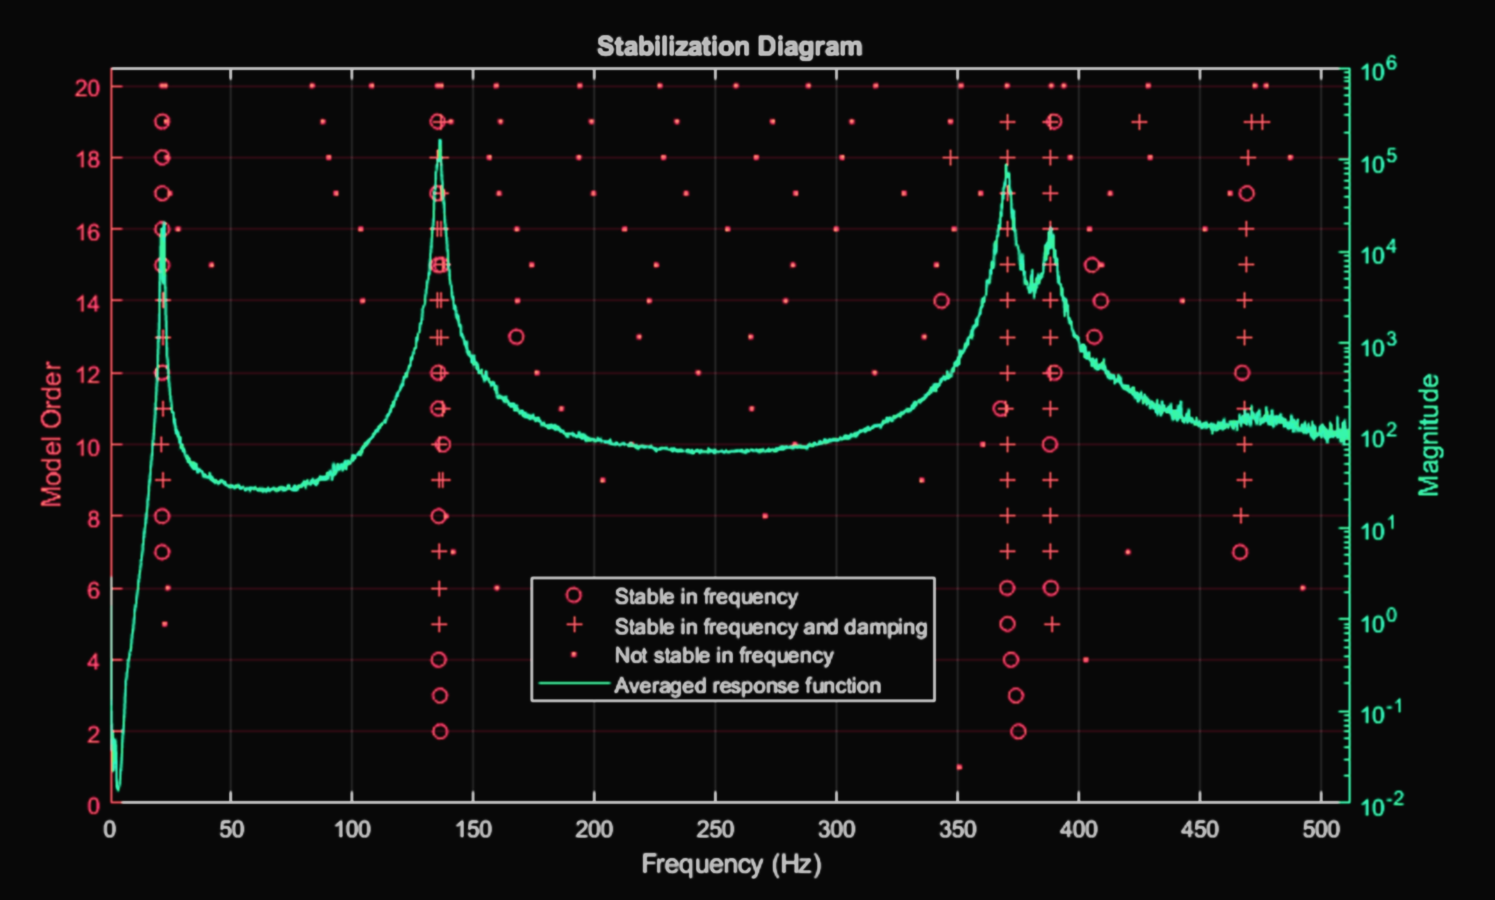 Unrelated Aesthetically Pleasing Plot
In a course on vibrations and modal analysis I worked on this experiment with Sarah. It was quite a nice culmination of all the knowledge we had learned from vibrations and experimentation. Although the report is scant on detail, a lot of effort went into behind-the-scenes work. I cut, chamfered, milled, and tapped the polycarbonate plate to create a standard measurement object for the vibrations lab. Sarah and I were methodical about our data collection and process. We spent a lot of time dialing in our measurements to maximize our coherence across the shaker excitation frequencies. We identified specific BNC cables with minimal noise through trial and error, determined which accelerometers were most accurate, adjusted the flex tubing support stiffness to improve response, and aligned the stinger of the shaker to oscillate exactly laterally to the plane surface.
Unexpectedly, the most important thing I learned from the course was probably digital signal processing. At my school they only taught this at the undergraduate level to electrical engineering students. I’m surprised it wasn’t included in a controls course for mechanical engineers, because if I left school without it I would have been totally unprepared. As it turns out, every modern control system is digital! For this project, it was essential to understand, for both the experimental design and data collection, sampling, aliasing, filtering, and calculating FFTs. In hindsight, the “FRF Configuration” (should be labeled FFT, not FRF) section of Table 4 is not specific enough to allow the reader to replicate the experiment. While the window type corresponds to the FFT windowing used, the parameter “Number of averages” has no meaning without further specification. How large were the windows? What was the overlap? I forget.
Hey, at least we got really clean peaks on our magnitude plots and cool mode shapes from the imaginary components!